First-ever index for drug resistance
 The next time you speak to your congressional representative about antibiotic resistance, take a deep breath. You may need to simplify matters.
For non-experts, reading antimicrobial resistance data is confusing because there are so many antibiotics. If one of these measurements increases, another decreases, and the rest stay the same, have things gotten better or worse? A single number would make it easier to explain to policy-makers, says Keith Klugman, William H. Foege Chair in Global Health and a leading expert on antibiotic resistance around the world.
“Economists do this all the time,” he says. “The end result is something that is easy to understand, even though it may be complex to calculate.”
Klugman has been developing a “Drug Resistance Index” in cooperation with economist Ramanan Laxminarayan, director of the Center for Disease Dynamics, Economics & Policy in Washington, D.C. Laxminarayan had the initial idea and came to Klugman for scientific advice on it.
The index combines a “basket” of resistance data for different drugs, similar to how groceries and other household items make up the cost-of-living index. These numbers are weighted according to the amount of each that is used. If a microbe develops resistance to a drug that is less critical, then the index will go up only slightly. If resistance occurs against a drug prescribed to almost every patient, the index will increase more.
“What lab monitoring picks up doesn’t map exactly to clinical treatment failures,” Klugman says. “Resistance to a particular antibiotic matters less when doctors have other choices, and more when they don’t.”
The goal is to assign one number to every microbe in every country and thus make it easier to emphasize the importance of smart drug policies and compare resistance in different states or countries. One obstacle to wider use is that detailed information on antibiotic resistance and consumption in developing countries is largely unavailable, says Klugman. Still, widespread adoption of the index could stimulate health ministries in developing countries to start collecting more data on antibiotics.
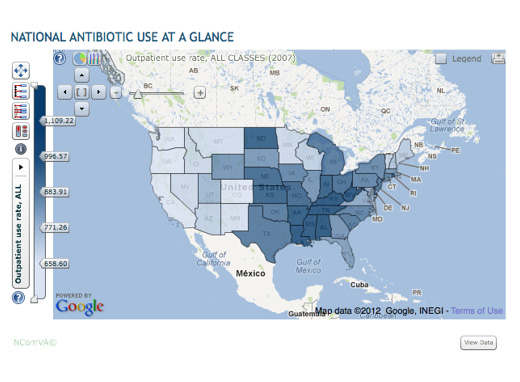
Klugman and Laximinarayan’s recent research indicates that the five states in the US with the highest antibiotic use in the nation are all in the Southeast: West Virginia, Kentucky, Tennessee, Louisiana, and Alabama.
“We found that there’s a considerable diversity of antibiotic use across the country,” he says. “There’s more variation, both regionally and locally, than we had initially expected.”
Their research shows that antibiotic use overall has fallen over the past decade by about 12%. However, prescription rates for the class of antibiotics called fluoroquinolones (such as ciprofloxacin) increased by 49% from 1999 to 2007, while resistance is increasing. These drugs are now much less likely to work against E. coli, the most frequent cause of bacterial infections, than they were in 1999.
In cooperation with CDC, Klugman is examining patterns of use and resistance data for pneumococcus bacteria, the type of bacteria that he has studied widely and is a major cause of childhood ear infections.—Quinn Eastman
An interactive map of antibiotic resistance data is available at http://www.cddep.org/ResistanceMap/use